Trasformiamo milioni di numeri in conoscenza
Approfondimenti sui più rilevanti aspetti legati all'epidemiologia e alla sanità pubblica: mortalità, ospedalizzazione per causa, programmazione sanitaria, personale del SSN.
I bilanci dello Stato e delle Regioni, le attività delle Camere di Commercio, il personale degli Enti Comunali italiani: alcune delle principali aree di interesse nell'ambito delle risorse della PA.
Rilevazioni e controlli di qualità, classificazioni e rapporti quantitativi, cruscotti decisionali e testi tecnico-scientifici: creazione e gestione delle banche dati, anche di rilevanti dimensioni.
 Rapporto Sanità
Programmazione Sanitaria
 Progetto Ermes
Personale Enti Locali
 Profili di Salute
Epidemiologia e Sanità
 Rapporto MEV(i)
Mortalità Evitabile
 Rendiconti delle ASL
White Paper Sanità
 Osservatorio Camerale
Rilevazione Dati On-Line
 Atlante ERA
Decessi e Ricoveri Evitabili
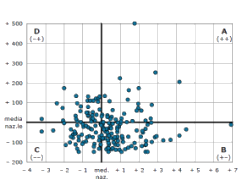
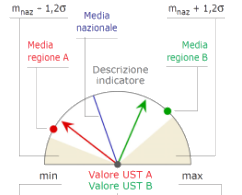
 Progetto Prometeo
Atlante della Sanità Italiana
Slow News - Sole24Ore - Mensa Italia - TV2000
Canale YouTube Centro Studi Nebo